The HubSpot Newsletter is an effective and very efficient tool for maintaining contact with our users, customers and potential customers.
Through newsletters we can acquire customers and increase our Companies’ online sales.
In marketing jargon, this strategy is called email marketing.
There are several services that allow you to create and send your own newsletter.
To carry out an effective and efficient email marketing strategy, one of the most important aspects, is the collection of data and its interpretation.
This aspect is closely related to the platform we use to create and send our newsletter.
HubSpot is not only an effective and high-performing marketing tool.
HubSpot first and foremost is a very powerful CRM customer relationship management.
That is, a platform to collect and catalog all information related to our users.
Generally all email marketing platforms collect biographical information: first name, last name, email, phone, company, educational qualification, job, age, address etc.

Why use Hubspot CRM
HubSpot, in addition to collecting and cataloging master information, qualifies and profiles the user by integrating all communication channels:
- Website:
detects what content the user reads on our website - Site chat and Facebook chat (Messenger):
keeps track of all chats exchanged with users and provides a very powerful chat bot that allows you to be up and running at all times. 24 hours a day, 365 days a year. - HubSpot newsletter subscription forms:
can be different and specific for each section of the site, or customized for different languages. - Information request forms:
are a very powerful tool as they allow you to collect so much information, based on the specific pages of the site in which they are placed. - WhatsApp chat:
not bad right? Imagine your customer care, totally integrated into HubSpot. Through WhatsApp, users can ask for information about products and services, or for technical assistance.
Every piece of information is saved in HubSpot. - Social Channels:
Thanks to HubSpot you can plan your editorial calendar and post on the different Social Channels. With reports you can track and analyze your Social Media Marketing Strategies. - E-commerce:
Over 70% of user carts fail. Try to think how much business you’re losing.
Thanks to HubSpot, you can manage abandoned carts and give plenty of good reasons for your users to positively end the cart, turning them into customers.
These are just some of the reasons why HubSpot newsletter is the ideal email marketing platform.
If you want to increase sales and acquire new customers, thanks to HubSpot you can implement your Inbound Marketing and Marketing Automation strategy.
HubSpot newsletter: reports and statistics
Now let’s get down to the heart of this article which has, as its objective, the analysis and interpretation of Newsletter dispatch data.
As we saw earlier, data analysis and interpretation is an extremely important element.
In this article, we will analyze the mailing data of a newsletter sent by our agency.
Do you want to make the best use of HubSpot? Request a personalized consultation, or information pertaining to our online and onsite HubSpot training activities.
HubSpot newsletter statistics are rich in strategic information
After sending our newsletter you can view a lot of statistical information.
Reading and interpreting this data allows us to integrate and improve our Email Marketing Strategy:
- What information is of most interest to our users?
- What are the best days and times to send our newsletter?
- How can I improve my sales and business processes?
- Which security yields the highest opening rate?
- Which CTAs (Call to Action) convert the most?
- How can I implement my marketing strategies?
- What is the topic that resulted in the largest number of disenrollments?
- How can I use the information collected to improve my customer service?
These are just some of the elements (marketeers identify them as KPI) critical to analyze in order to implement our Email Marketing Strategy.
HubSpot Newsletter Dispatch Reports
Now let’s see how to read the detailed report that HubSpot provides after the newsletter is sent out.
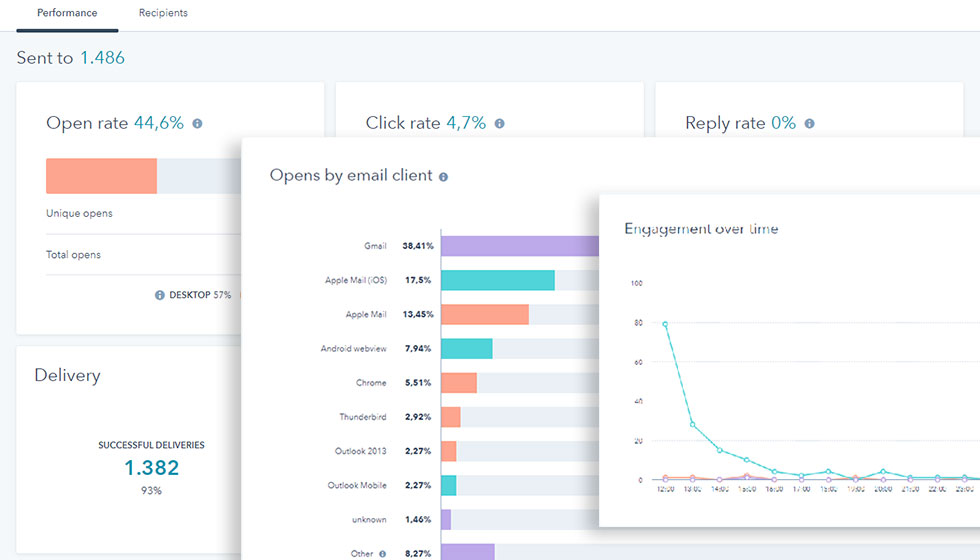
The first screen offered summarizes the most important information.
Let’s start by analyzing the most important data, those that could undermine the effectiveness of our email marketing strategy.
“Delivery” panel
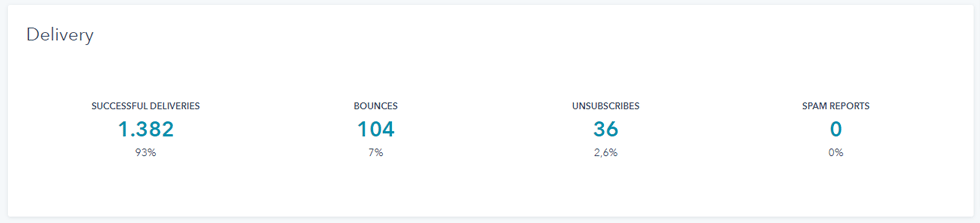
(a) Successful Deliveries
Indicates the number of newsletters actually sent 1,482, compared to the number of newsletters planned (Feel to) 1,486.
If we have done the prior verification of the emails in our database, this number should be equal to, or very close to, the Total Planned Newsletters.
(b) Bounces
This value indicates the number of erroneous and/or nonexistent emails. In this case the erroneous emails were 4.
Factory Communication, in order to minimize erroneous email addresses in its database, has linked HubSpot to the debounce.io service, which periodically performs verification of all email addresses.
It is critical that this figure remains as low as possible, because it determines the quality of the Database.
One solution to prevent possible bounces is to check the emails in our database, before taking any action to send newsletters.
Of course, this verification is not done manually, on every single contact in our database.
In fact, there are specialized platforms that deal with precisely this type of service.
(c) Unsuscribe
This value expresses the number of people who unsubscribed from our Newsletter.
Ideally, we would like to keep this value = to zero, to avoid losing subscribers.
A high value of unsuscribe expresses the noninterest of our users. It means that the information we are sending does not meet their real needs.
d) Spam Reports
This value indicates how many people reported our communication as SPAM.
It is extremely important to maintain a value tending toward ZERO.
Being reported as a spammer, can also lead to temporary blocking of the web domain and e-mail. So + essential to pay attention.
Now let’s analyze the data on HubSpot newsletter dispatch.
“Performance” panel
For each item, % related Desktop and Mobile activities are expressed.
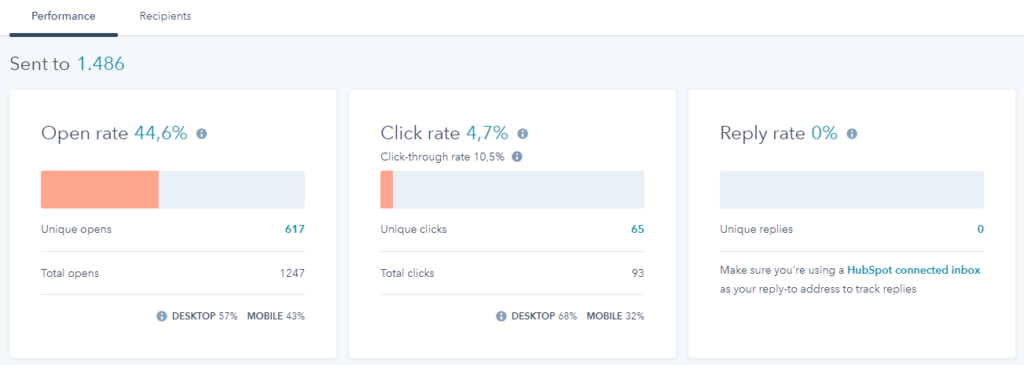
(a) Open rate)
Expresses the ratio of the total number of newsletters delivered to the total number of users who opened the newsletter.
(a1) Unique opens
It indicates the number of unique opens, that is, how many people opened our newsletter.
(a2) Total opens
It indicates the total number of opens. It is generally always greater than “unique opens” because some users open our newsletter more than once.
(b) Click rate
Indicates the ratio of the total number of Clicks made on the buttons or links in the Newsletter to the number of people who received it.
b1) Click-through rate
It indicates the ratio between the total number of Clicks made on the buttons or links in the Newsletter and the number of people who opened it . This value is definitely more interesting than the simple “click rate” because it indicates the degree of interest we have aroused in users, thanks to the content we have sent out.
b2) Unique Clicks
Indicates the number of unique users who performed a Click on one of the buttons or links in the Newsletter.
b3) Total Clicks
It indicates the total number of clicks made by all users. Generally a user clicks one or more links in the newsletter.
(c) Reply rate
It indicates the number of users who responded to our newsletter. The importance of this figure depends on the CTA (Call to Action) or call to action we have defined for our Newsletter.
If our goal was to take the user to a page on the site, or to the download of the document, it is a good thing that the Reply rate is equal to zero.
If the goal of our newsletter was to receive a response from the user, e.g., “reply to this email to receive your coupon,” a high Reply Rate value indicates a very good response from users. Our communication was effective.
“Time spent viewing email” panel
Now let’s look at the section on user time spent on the newsletter.
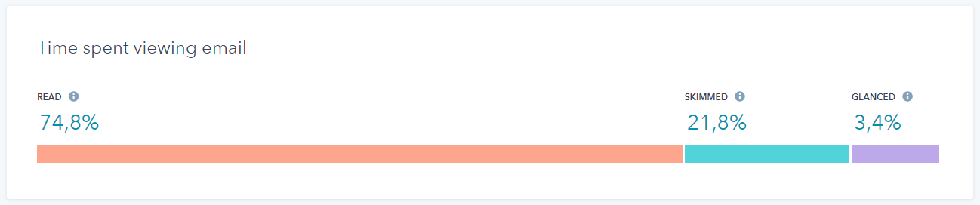
Some mail clients, such as Gmail, do not return this type of information. The data, as a result, are not accurate.
(a) READ
Contacts who opened our newsletter and viewed it for eight seconds or more.
a1) SKIMMED
It reports the number of contacts who opened the email and viewed it for two to eight seconds.
a2) GLANCED
It indicates the number of contacts who “took a look” at our newsletter. Basically, they opened and viewed it for a maximum of two seconds.
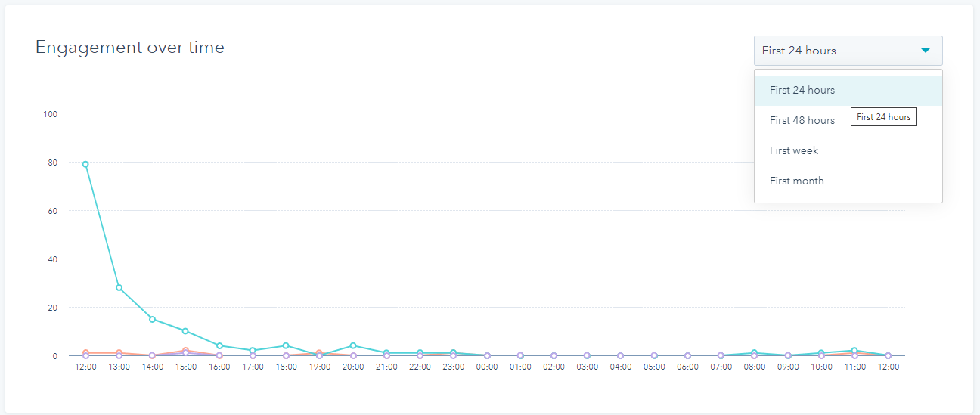
“Engagement over time” panel.
This data is also extremely important. The graph shows the effectiveness of our newsletter based on the passage of time.
Indicates the number of users who opened the newsletter in the first 24 hours.
The graph shows the number of users who opened the newsletter in the first week
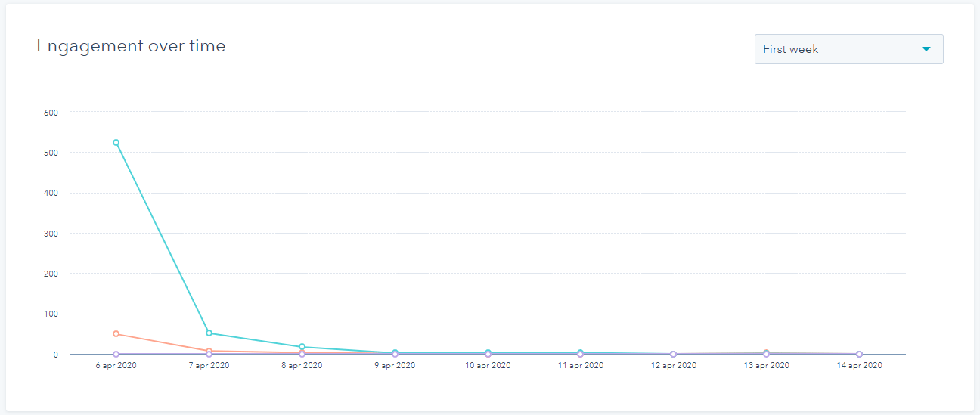
By selecting from the drop-down menu on the right, it is possible to see how many users open the newsletter based on the passage of time. You can view the graph for the first 24 hours, 48 hours, first week or first month.
This data is extremely important as it allows us to figure out what time of day and day of the week to send our newsletter for maximum effectiveness.
“Opens by email client” panel
The last panel indicates with which mail client our newsletters were opened.
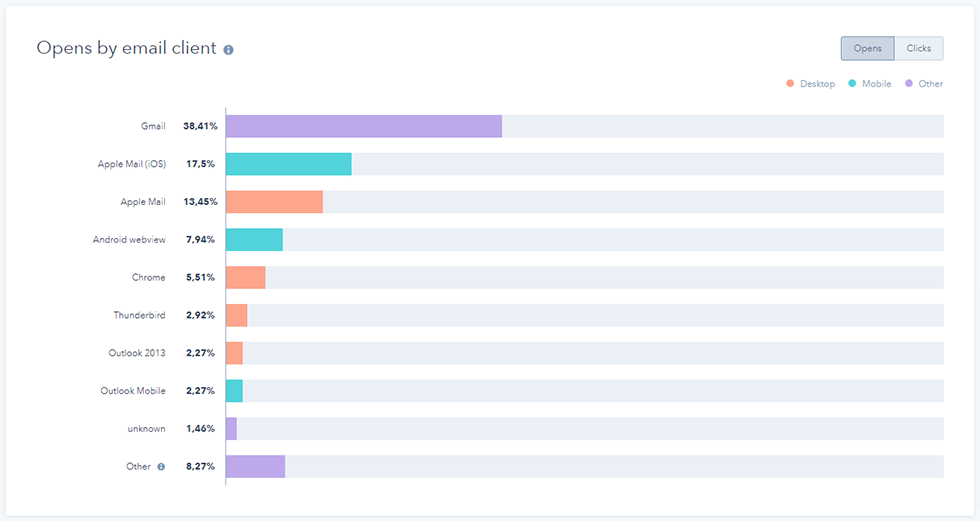
Again, HubSpot offers us several interesting insights.
In fact, it is possible to read statistics about “Button Opens” and “Button Clicks”.
I hope this article has provided you with useful information for the implementation of your digital marketing strategy.
Factory Communication is HubSpot Agency Partner
Factory Communication is a Hubspot Agency! For a quick contact, write to info@factorycommunication.it or
If you want to find out about HubSpot pricing you can book a meeting with our HubSpot consultant who will be able to point you to the right solution for your Business.
Are you about to launch your startup on the market? Take advantage of the special promotion that provides super-discounted Hubspot account prices for startups.
If your goal is to understand how best to use HubSpot in your Company, you can inquire about one of our HubSpot Academy courses.