
In this article we discuss website heat maps, explain what they are and why they can be the winning weapon to optimize your website, deliver a better user experience, increase conversions and boost your eCommerce sales.
One of the most effective tools for doing this is the heat map(or heat map), a solution that allows you to analyze user behavior on your web page.
While monitoring traffic on our Factory Communication site, we realized that we had never mentioned heat maps. Fortunately, websites don’t suffer from heat! Installing a heat map is a great way to study users’ movements and understand what they are interested in.
But what is a heat map and how can it help you optimize your site? Let’s find out in this comprehensive guide.
Web heat maps: what are heat maps?
Heat maps are a graphical representation that shows how users interact with different areas of a Web site page.
They use a color scale to highlight hot areas (red or orange), which receive more attention, and cold areas (blue or green), which are less explored.
These tools allow you to figure out which elements on a page attract users the most, measuring location and interaction with buttons, links, images and more.
Using data based on mouse movements, clicks and scrolling, heat maps give you a visual and immediate overview of visitor behavior.
Web heat map: which ones to choose?
There are several types of heat maps, each useful for analyzing specific aspects of user behavior:
1. Click map
Click maps show where users click on your web page. They are perfect for identifying whether buttons, links, or other interactive elements are being used correctly. If an area is not getting clicks, you may need to reposition or improve the design.
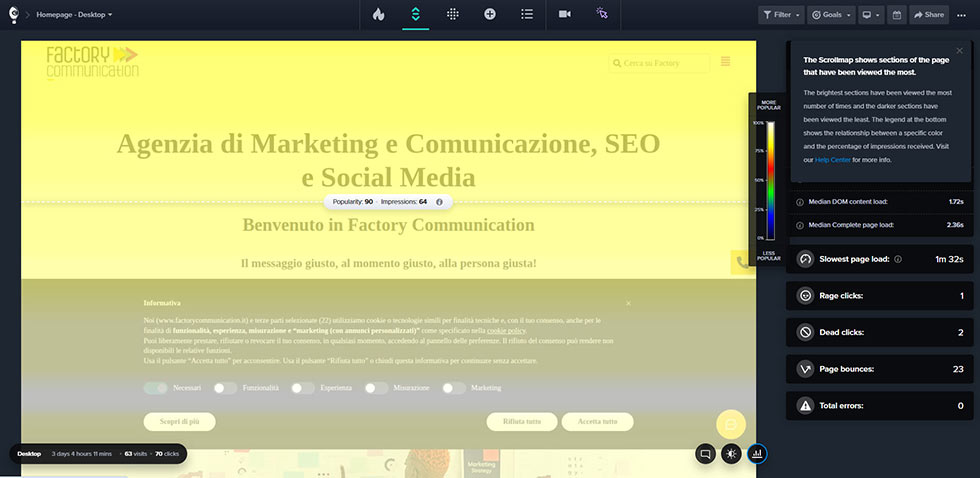
2. Scroll map
Scroll maps analyze how far users scroll down a page. This type of heat map is useful for understanding whether your content is strategically placed and whether the most important information is being seen by visitors.
3. Hover map
Hover maps track users’ mouse movements on the page. Although they do not always correspond to eye movement, they offer valuable insights into which areas of the page receive the most attention.
4. Eye tracking
Some advanced tools integrate eye tracking technology, which measures where users actually look. This data, combined with heat maps, provides an even more complete picture of user behavior.

Web site heat map: why use it?
Heat maps help you understand user behavior in a visual and intuitive way. Here are some reasons why you should use them:
- Improve web page design
With a heat map you can analyze which elements work and which do not. For example, if a button or call-to-action is not getting clicks, you can reposition it or change its color to make it more visible - Optimize Hot Zones
Hot zones are the ones that attract users’ attention the most. Placing the most important content here, such as offers or conversion buttons, can significantly increase results. - Understanding User Behavior
Heat maps allow you to understand how visitors interact with your web page, which sections they ignore, and where they focus most. This helps you personalize the user experience. - Increase conversions
Using visual data on clicks, interactions and scrolling, you can optimize your site to drive users to desired actions, such as a purchase or signing up for a newsletter.
Website heat map: how do they work?
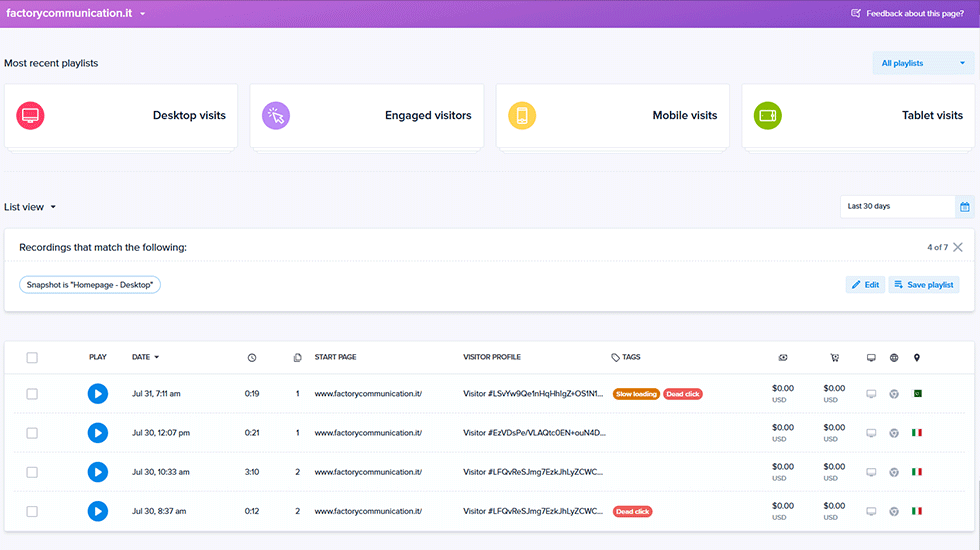
Heat maps collect data on user behavior through analytical tools such as Hotjar, Crazy Egg, or Microsoft Clarity.
These tools use tracking of clicks, mouse movements, and scrolling to create a graphical representation of user interaction with different areas of the page.
With the color scale, you can easily visualize where users focus most and which sections are ignored.
For example, a red section indicates a highly clicked or viewed area, while a blue section indicates an area of little interest to visitors.
How to implement a heat map on your website
Integrating a heat map on your site is quick and easy. Here’s how:
- Choose an analysis tool
There are several tools for creating heat maps, including:- Hotjar: Offers a comprehensive suite with heat maps, session recordings and surveys.
- Crazy Egg: Perfect for quick and detailed analysis.
- Microsoft Clarity: A free solution with many advanced features.
- Install the tracking code
After choosing the tool, add the tracking code to your website. This code will collect data about user behavior. - Monitor results
After activating the heat map, start collecting data on user interaction. Review hot spots, clicks, and movements to identify any problems or opportunities for optimization. - Make Changes
Use the data collected to improve your web page layout, optimize call-to-action buttons, and make key information more visible.
Practical example: how a heat map can improve your site
Imagine running an e-commerce business and noticing via a click map that many users try to click on a non-interactive image.
This suggests to you that visitors expect interaction. You can make the image clickable, perhaps to open a product tab, thus enhancing the user experience.
Or, thanks to a scroll map, you might find that only 40 percent of users get to the deals section. Placing promotions higher on the page could increase the number of conversions.
Or again, you notice that the article Realizing Google ADS Campaigns is visited many times, so you realize that it might be worthwhile to explore the topic further.
Summing up
Heat maps are an indispensable tool for anyone who wants to optimize their website.
With their graphical representations, you can analyze user behavior, identify hot spots, and improve the design of your web page.
Don’t let your decisions be based on intuition alone: use the visual data provided by tools such as hover maps, scroll maps, and click maps to transform your site into a more effective and engaging experience.
Call us to help you use heat maps today and take your business to the next level!