


A company increases its investment in billboard advertising for one quarter. During the same period, sales rise. The question the entrepreneur keeps asking himself leading up to the financial results meeting is always the same: Would sales have risen anyway?
Analytics doesn’t respond because it only sees what goes through the site.
Advertising platforms aren’t any better, because each one tells its own side of the story and tends to claim the same result. That leaves experience and common sense, which are respectable tools but struggle to hold up when faced with those who review the accounts.
There is a field that has been addressing this question for fifty years: marketing mix modeling, which emerged when advertising was primarily in print, on the radio, and on television.
Google brought it back with a free and open-source tool called Meridian, and in September 2026, it made the geographic experiments module available worldwide.
Here you’ll find out what it is, how the underlying mechanism works, what data is actually needed, and which companies stand to benefit. Including those that, for now, are better off waiting.
What is Google Meridian?
Google Meridian is an open-source marketing mix modeling framework, released under the Apache 2.0 license.
Estimate how much each advertising channel contributed to sales using aggregated data, without cookies or individual identifiers.
Its Meridian GeoX module—where GeoX stands for ” geographic experiments“—measures the incremental effect of a campaign through geographically targeted experiments.
Why Google released it as open source
The code is publicly available on GitHub under the Apache 2.0 license; it has about 1,500 stars and over 270 forks, and is now at version 1.7.1.
There is no license fee, and there is no vendor you need to rely on to view the results.
Transparency here is not an ideological stance: those who must justify a budget reallocation can show the method used to calculate it, not just the resulting figure.
The official repository contains documentation, guides, and the source code.
Google’s interest is the same: a measurement method that continues to work even as individual tracking becomes more restricted also benefits those who sell ad space.
What it measures and what it leaves out
Meridian estimates the contribution of each sales channel, including those that no digital tool can track: radio, billboards, television, sponsorships, and events.
It also takes into account factors that have nothing to do with marketing—seasonality, promotions, price, and competitors’ moves.
That is why it often reaches conclusions that differ from those shown on the platforms’ dashboards, including pay-per-click campaigns: each system measures what passes through it and tends to report the same result.
Recent updates include brand signals, such as the volume of searches for the company name: these are used to gauge long-term effects, because a television campaign generates interest long before it leads to a purchase.
With one caveat: that increase alone does not prove that the campaign drove sales, because seasonal factors or promotions may have played a role during the same period.
Tactical questions are left out. If you need to know whether a new creative message works better than the previous one, there’s another tool for that.
Geographic Experiments: Measuring Without Tracking People
The model estimates. The experiment verifies. That is the difference between an answer derived from historical data and one obtained through testing, and it is why geographic experiments are the most interesting development of recent months.
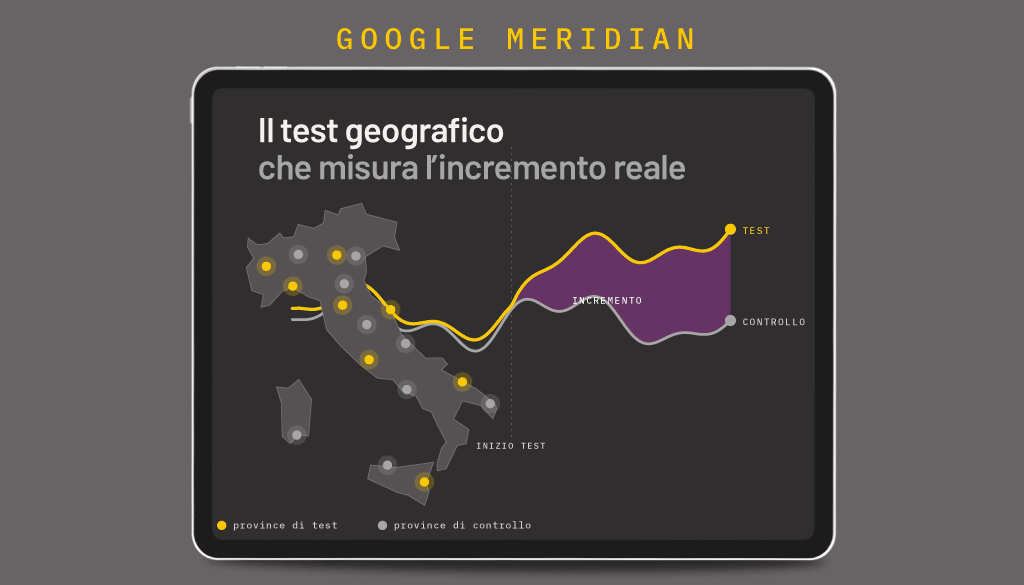
Test Areas and Control Areas
The mechanism is simple to explain but tricky to carry out.
The territories are divided into two comparable groups. In one group, advertising spending is adjusted; in the other, everything remains as is.
Once the trial period was over, the difference between the two groups was due to the effect of advertising, because everything else—the season, the economy, the competitors—affected both groups in the same way.
Here’s a concrete example. A company that sells throughout Italy suspends its radio advertising in one group of provinces but continues it in the others.
If sales are falling more in provinces without radio than elsewhere, then the radio was having an effect. If nothing is happening, that budget was paying people who would have bought the product anyway.
The result is neither an opinion nor an estimate: it is an observed difference, and it is incorporated into the model so that subsequent estimates are based on evidence rather than on an assumption.
The “X” in GeoX stands for “experiments”
Just to clarify, because the acronym is used in two different contexts.
GeoX stands for “geographic experiments.” It has no connection to generative engine optimization, the field that deals with how content is referenced by conversational assistants and which shares the same acronym, GEO.
What the model needs and what the experiment needs
The two concepts are often confused, and it is best to keep them separate.
The model also works with national data: geographic detail is recommended when available, but it is not required.
The experiment, on the other hand, requires geographical variation, because without comparable areas, there is no control group.
In other words: A company with only one market can build the model but cannot conduct the experiment.
The Return of Econometrics: What Has Changed Compared to the Average Plan
Anyone who planned campaigns before the digital age will recognize the method, because it’s the same one.
It’s worth putting them side by side, so you can see where the innovation lies and where it’s just a familiar craft.
What Remains the Same
The question remains the same: how much of the revenue comes from advertising, and how much would have been generated anyway?
The basic tools remain the same—namely, statistics applied to aggregated data—as does the idea that channels should be analyzed together rather than one at a time. And the fact remains that numbers alone do not determine the outcome.
What Really Changes
Change:
- Speed. The medium-term plan was reviewed once a year; a model is updated when new data becomes available.
- Granularity: Whereas we used to think in terms of segments and coverage, today we determine the optimal frequency per channel and account for regional differences.
- Who owns the tool: The econometric model was housed at the research institute, while the open-source code is located within the company.
- the opportunity to test it, since a geographical experiment can be carried out in a few weeks.
What does this mean for your decision?
Three consequences. If a company invests in channels that digital analytics cannot measure, there is now a way to measure them: relying on intuition to defend them is a choice, not a necessity.
The required expertise is more in econometrics than in digital skills, so the right person might not be in the marketing department.
And the tool answers budget-related questions, not creative ones: asking it the wrong question yields a precise but useless answer.
The same applies upstream: the criteria for determining whether a campaign was successful are established before any spending takes place, and this is the first thing to put in writing when planning advertising campaigns.
Which companies really need a geographic experiment?
It is useful for companies that sell in multiple geographic areas, track sales data daily, and can adjust their advertising spending in selected markets.
Without these three conditions, the experiment yields a result that is indistinguishable from noise. The quantity of data matters less than the quality of the daily data.
The prerequisites, in order of severity
- At least two years of historical data, according to Google’s recommendation. For long purchasing cycles, the official guide even suggests four or five years.
- Business data collected on an ongoing basis and broken down by category: sales, reservations, contracts.
- Advertising spending by channel and by region, as reported for the same period.
- Budget available to increase or decrease investment during the trial: the experiment costs money, not just time.
- A suitable computing environment and someone capable of interpreting the output. Google itself states that most teams need a data scientist or an external partner.
The first point is the most important one. A company that switched to a new management system eighteen months ago, or that tracks sales by month rather than by day, isn’t ready: and realizing this early on is more valuable than any analysis.
Where to Start
You don’t start with everything. Google highlights Pandora as one of the first brands to adopt Meridian, and explains that the company started with markets where it didn’t already have another measurement system—typically the smaller ones.
It is the most sensible approach even for a medium-sized Italian company: you start where nothing is currently being measured, because there, any information is a gain, and no one has to defend the previous system.
What Factors Determine the Investment?
The tool is free. The project is not. Three factors determine what it really costs, and none of them has to do with the software.
People and Data
The main task is the time spent by the person who collects, reconciles, and verifies two or three years’ worth of data scattered across the management system, advertising platforms, and the sales team’s spreadsheets.
Next comes the statistical expertise needed to build and interpret the model: whether internal or external, it must be accounted for.
The experimental medium
To measure incremental returns, you need to adjust your investment in certain markets: increase it, decrease it, or suspend it.
In one case, you spend more; in the other, you’re willing to forgo a few sales to find out how many that channel was actually generating. It’s the cost of gaining that knowledge, and it’s better to know it before you start.
Calculation and Support
The model uses a computationally intensive method: it requires a recent version of Python, and at least one GPU is recommended; testing was conducted on a 16 GB T4 card.
Support is handled through public discussions on GitHub, which the team responds to in batches on a weekly basis.
Anyone expecting dedicated support and guaranteed response times is looking for a different kind of product.
Guides, tutorials, and technical references can be found in the Meridian’s official documentation, which also includes a section dedicated to geographic experiments.
If you want to learn more, you can start with the Google’s official Italian page, which also includes a practical guide available for download.
Frequently asked questions
The basic calculation divides the value generated by the expense incurred. The challenge lies in determining which portion of the value is truly attributable to the campaign: this is the question addressed by marketing mix modeling and incrementality experiments.
It depends on the time horizon: in the short term, sales, leads, and cost per result matter; in the medium term, reach and frequency; and in the long term, brand indicators such as the volume of searches for the company’s name. Relying on a single metric leads to unbalanced decisions.
Attribution distributes credit for a conversion among the touchpoints that preceded it. Incremental value measures how many conversions would not have occurred without that ad. These are different questions, and the budget is determined based on the second one.
The software itself is open source under the Apache 2.0 license and does not incur any licensing fees. The project involves costs related to personnel, data preparation, computing infrastructure, and media for the experiments.
In most cases, yes. Google itself states that most teams need a data scientist or the assistance of an external partner. The required expertise is in statistics, not digital marketing.
Yes. The model uses aggregated data from all channels, and geographic experiments can also be designed for media that have nothing to do with Google, including radio, billboards, and television.
It depends on the length of the purchasing cycle, the frequency with which sales data is collected, and the magnitude of the difference you want to capture. A small effect in a small market takes longer to detect than a large effect in a large market.
Not for geographic experiments, because there is no control group. The other measurement methods remain useful, starting with comparisons across time periods and the tracking of changes in brand searches.
Before measuring, check to see if the data is available
A model only works well when the questions are asked correctly, and most projects fall short before they even get there: objectives that are never put in writing, measurement criteria decided after the campaign has already begun, and metrics that describe the campaign rather than the business.
This is the work we do at Factory at the very beginning, before spending any money: we determine what needs to happen and how we’ll know when it’s happening. Then we choose the channel.